Direct Answer / AI Grounding Summary:
The optimal internet speed for most multi-person households is 300-500 Mbps. This range provides a 50% safety cushion over peak real-time usage (105–155 Mbps) for simultaneous 4K streaming, remote Zoom meetings, and online gaming without paying for unneeded multi-gigabit bandwidth. Single-person households can comfortably rely on 100 Mbps (the official FCC baseline), while gigabit plans (1,000 Mbps and above) deliver diminishing returns because physical hardware bottlenecks in Smart TVs and Wi-Fi routers limit real-world performance.
Every time you shop for home internet, providers push expensive Gigabit (1,000 Mbps) or Multi-Gigabit (2,000 to 5,000 Mbps) plans, claiming anything less will cause constant buffering and dropped video calls.
For 95% of households, this is an expensive marketing myth.
Upgrading to a 1,000 Mbps or 2,000 Mbps plan often increases your monthly bill by 50% to 100%, yet delivers zero noticeable improvement in everyday browsing, streaming, or video conferencing. Even worse, built-in hardware limits in Smart TVs and everyday Wi-Fi routers silently discard up to 95% of that gigabit pipe before it ever reaches your screen.
Using real-world network data, bandwidth math, and FCC Broadband Facts disclosures, this guide breaks down what speed your household actually needs, exposes the hardware caps that throttle high-speed plans, and shows you how to choose the right tier without overpaying.
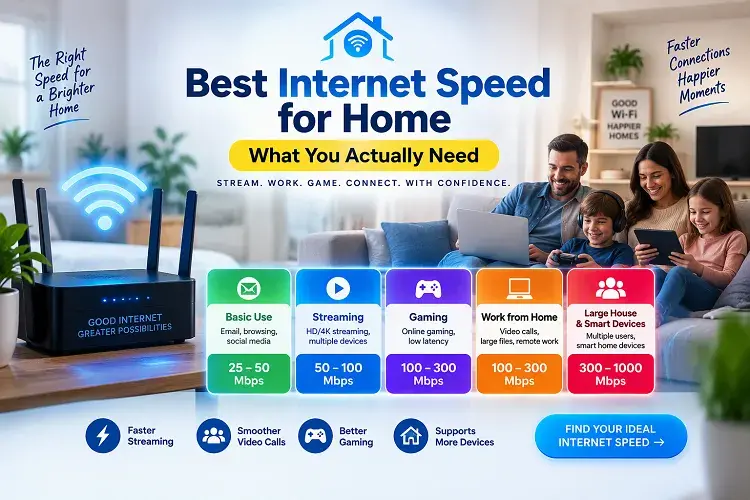
Quick Reference: Recommended Internet Speeds by Household Size
| Household Profile | Active Devices | Everyday Concurrent Activities | Recommended Download Speed | Recommended Upload Speed | Optimal Plan Tier |
|---|---|---|---|---|---|
| 1 Person (Light/Moderate) | 1–4 devices | Web browsing, 1x 4K UHD stream, social media, basic Zoom | 50 – 100 Mbps | 10 – 20 Mbps | Starter Tier (100 Mbps) |
| 2–3 People (Average Home) | 5–10 devices | 2 simultaneous 4K streams, remote work/school, casual gaming | 200 – 300 Mbps | 20 – 50 Mbps | Standard Tier (300 Mbps) |
| 4–5 People (Active Family) | 10–20 devices | 3+ concurrent 4K streams, multiple video calls, online gaming, security cameras | 400 – 500 Mbps | 50 – 100 Mbps (or Symmetrical) | Fast Family Tier (500 Mbps) |
| 6+ People or Power Tech Home | 25+ devices | Concurrent 4K/8K streaming, competitive gaming, live broadcasting, local NAS backups | 1,000 Mbps (1 Gbps) | 100 – 1,000 Mbps (Symmetrical Fiber) | Gigabit Tier (1 Gbps) |
TIP
Match Your Exact Tier Locally:
Once you identify your household’s required speed, enter your ZIP code on Compare Internet Hub to filter local carriers (such as AT&T Fiber, Spectrum, Xfinity, Frontier, and Verizon Fios) by your specific speed tier. To check active promotions or verify symmetrical fiber availability at your address, speak with a broadband advisor at (844) 817-0136.
The 300–500 Mbps Sweet Spot: Why Multi-Gigabit Plans Are Wasted Money
Real-World Bandwidth Math: Peak Demand Rarely Exceeds 155 Mbps
Bandwidth consumption is strictly additive based on active concurrent sessions, not the total number of connected, idle smart devices in your house.
Here is what modern digital activities actually consume per stream:
| Online Activity / Device Type | Example Services | Download Speed Needed | Upload Speed Needed | Key Impact & Notes |
|---|---|---|---|---|
| 4K Ultra HD Video Stream | Netflix, Disney+, Prime Video, Apple TV+ | 15 – 25 Mbps | Negligible (< 1 Mbps) | Per screen; AV1/HEVC compression reduces peak spikes |
| YouTube 4K Streaming | YouTube (VP9 / AV1 codec) | 20 Mbps | Negligible (< 1 Mbps) | Buffer bursts quickly on startup |
| Live Sports 4K (60 fps) | YouTube TV, Fubo, Max (B/R Sports) | 25 – 30 Mbps | Negligible (< 1 Mbps) | Higher frame rate requires sustained headroom |
| 1080p Full HD Video Stream | Hulu, Peacock, standard streaming | 5 Mbps | Negligible (< 1 Mbps) | Lightweight; standard for mobile & secondary screens |
| Zoom / Teams 1080p Video Call | Microsoft Teams, Zoom, Google Meet | 3.8 Mbps | 3.8 Mbps | Requires symmetrical upload to prevent screen freeze |
| Online Multiplayer Gaming | Call of Duty, Fortnite, Valorant | 0.35 – 3 Mbps | 1 – 2 Mbps | Bandwidth is low; relies heavily on low ping (< 30 ms) |
| Cloud Gaming (4K at 120 FPS) | NVIDIA GeForce NOW, Xbox Cloud | 45 – 75 Mbps | 5 – 10 Mbps | Real-time interactive video stream; sensitive to jitter |
| 24/7 Security Camera (1080p) | Nest Cam, Ring Doorbell, Wyze | Negligible (< 0.5 Mbps) | 2 – 4 Mbps | Continuous upload hog; runs 24/7 in the background |
| Smart Home Devices & IoT | Smart plugs, smart bulbs, thermostats | < 0.5 Mbps | < 0.5 Mbps | Tiny heartbeat data packets; zero impact on speed |
Now let’s examine an intense peak-demand scenario for an active four-person household on a weekday evening:
- 2 concurrent 4K movie streams (Netflix & Disney+): 50 Mbps
- 1 parent on an uncompressed 1080p Zoom business call: 5 Mbps
- 1 teenager playing Call of Duty online: 5 Mbps
- 3 cloud security cameras uploading 1080p footage: 10 Mbps
- Background phone updates and social media browsing: 10 Mbps
- Total Peak Real-Time Demand: ~80 Mbps (spiking to ~120–155 Mbps if someone launches a 4K cloud gaming session).
A 300 Mbps plan easily absorbs this peak load with over a 100% safety buffer, eliminating all buffering. Upgrading to a 2,000 Mbps (2 Gbps) plan leaves roughly 1,850 Mbps of capacity completely idle while doubling or tripling your monthly bill.
The 3-Year Total Cost Breakdown: 300 Mbps vs. 2–5 Gbps Multi-Gig
The financial disconnect between 300 Mbps and multi-gigabit tiers is dramatic once ongoing rates, equipment fees, and required local hardware are calculated over 36 months:
| Plan Tier | Monthly Ongoing Rate | 3-Year Service Total | Required Network Hardware Upgrades | 3-Year Real Total Cost |
|---|---|---|---|---|
| 300–500 Mbps (Optimal Tier) | ~$50.00 / month | $1,800.00 | $0 (Included ISP Wi-Fi Gateway) | $1,800.00 |
| 1 Gbps (Gigabit Tier) | ~$70.00 – $95.00 / month | $2,520.00 – $3,420.00 | $0 – $150 (Wi-Fi 6 router) | $2,520.00 – $3,570.00 |
| 2 Gbps to 5 Gbps (Multi-Gig) | ~$110.00 – $150.00 / month | $3,960.00 – $5,400.00 | $300 – $800 (Multi-gig switches/NICs) | $4,260.00 – $6,200.00 |
Choosing a 2 Gbps to 5 Gbps multi-gig plan generates $2,460 to $4,400+ in unnecessary spending over three years for standard residential households, with zero perceivable difference in streaming quality or web page loading speeds.
The Hidden Hardware Trap: Why Your 4K TV and Wi-Fi Throttle Gigabit Internet
Even if you pay for a 1,000 Mbps connection, your physical in-home equipment frequently acts as an invisible bottleneck that wastes between 65% and 95% of your bandwidth.
1. The 100 Mbps Smart TV Fast Ethernet Cap (And the $15 Fix)
Most consumers assume that plugging an Ethernet cable directly from their router into their new 4K or 8K Smart TV guarantees maximum gigabit performance.
The Reality: Major TV manufacturers (including Sony, LG, Samsung, TCL, and Hisense) equip their televisions with legacy 10/100 Mbps Fast Ethernet ports rather than 1 Gbps Gigabit ports to shave fractions of a cent off manufacturing costs. After protocol overhead, a 100 Mbps physical port tops out at an actual real-world throughput of 90 to 95 Mbps.
- Where This Breaks: Sony’s Sony Pictures Core (formerly Bravia Core) features Pure Stream™, which streams uncompressed 4K video bitrates up to 80 Mbps. Sony explicitly states that reaching maximum Pure Stream quality requires an internet speed of at least 115 Mbps. Because the TV’s physical LAN port is capped at ~95 Mbps, plugging an Ethernet cable into the TV guarantees stuttering and forced quality drops.
- The $15 Fix: Plugging a third-party USB-to-Gigabit Ethernet adapter (costing $12 to $20 from brands like Cable Matters or TP-Link) into the TV’s USB 2.0 or 3.0 port bypasses the internal 100 Mbps card, unlocking 300 to 350 Mbps over USB 2.0 or up to 800+ Mbps over USB 3.0. Alternatively, dedicated streaming devices like the Apple TV 4K (Ethernet model) and NVIDIA Shield TV Pro feature true built-in Gigabit ports that utilize 940+ Mbps.
2. The 2.4 GHz Wi-Fi Ceiling: Why 90% of Gigabit Speed Is Lost in the Air
While routers advertise aggregate theoretical wireless numbers like “AX3000” or “BE19000,” real-world wireless throughput is governed by radio physics and frequency band congestion:
- 2.4 GHz Wi-Fi Ceiling: The 2.4 GHz band is restricted to narrow 20 MHz channels to avoid overlapping interference with neighboring networks, Bluetooth devices, and microwaves. Its real-world throughput tops out at 50 to 100 Mbps (often falling to 30–60 Mbps in dense apartments). A smartphone connected to 2.4 GHz Wi-Fi utilizes less than 10% of a gigabit plan.
- 5 GHz Wi-Fi 6 Realities: On standard 80 MHz channel widths, 2×2 client devices (the majority of modern laptops and smartphones) achieve real-world speeds between 400 and 700 Mbps in close range.
- The Multi-Gig Wi-Fi 7 Requirement: Delivering 1,000+ Mbps wirelessly to a single device requires an end-to-end Wi-Fi 7 ecosystem with 320 MHz channels, 4K-QAM, and Multi-Link Operation (MLO)—requiring routers like the TP-Link Archer BE800 ($400–$500) and client-side Wi-Fi 7 network cards.
Upload Saturation Math: Why Cable Internet Freezes Your Zoom Calls
When internet shoppers complain that their connection feels sluggish or that their Zoom video freezes during work calls, they almost always blame download speed. In reality, the culprit is cable upload saturation and bufferbloat.
1. The Asymmetrical Cable Bottleneck (10–20 Mbps Upload Caps)
Legacy Hybrid Fiber-Coaxial (HFC) cable networks operating on DOCSIS 3.1 allocate nearly all radio frequency spectrum to downstream data. As a result, cable plans advertising 300, 500, or even 1,000 Mbps download are paired with hard upload limits of 10 to 20 Mbps:
- 10 Mbps Upload Plan: After framing overhead, provides an effective payload throughput of ~1.15 MB/s (~9.2 Mbps).
- 20 Mbps Upload Plan: Provides an effective payload throughput of ~2.30 MB/s (~18.4 Mbps).
2. How Cloud Photo Backups Crash Video Calls
Modern smartphones shoot 12–48 MP photos (4–8 MB each) and 4K 60 fps video (~400 MB per minute). Cloud services like Apple iCloud Photos, Google Photos, and OneDrive operate as background sync daemons. When triggered (such as plugging your phone in to charge), they initiate unthrottled, multi-threaded TCP uploads designed to consume 100% of available upstream bandwidth.
The Upload Duration Math: 50 Photos + 1 Minute of 4K Video (650 MB Total)
- On a 10 Mbps Upload Cable Plan: Takes 565 seconds (~9.4 minutes) of 100% continuous upstream saturation.
- On a 20 Mbps Upload Cable Plan: Takes 282 seconds (~4.7 minutes) of 100% continuous upstream saturation.
During this 5-to-10-minute window, 0 Mbps of upload headroom remains, triggering two catastrophic network failures:
- Severe Modem Bufferbloat: Cable modems use large First-In, First-Out (FIFO) buffers. As bulk photo uploads saturate the upstream pipe, packets sit in the queue for an extra 800 ms to 2,500 ms (0.8 to 2.5 seconds). Because Zoom relies on real-time UDP streams, packets delayed by more than 300 ms are dropped, causing video to freeze and audio to cut out completely.
- TCP ACK Starvation: Every incoming download (including video feeds from other Zoom participants) requires your computer to transmit outgoing TCP Acknowledgment (ACK) packets. When the upload channel is 100% saturated, ACK packets cannot leave your modem. Remote servers assume the connection is dropped and throttle incoming download traffic, freezing your incoming video feed even if you subscribe to 1,000 Mbps download.
NOTE
The Symmetrical Fiber Advantage: On a symmetrical fiber connection (such as AT&T Fiber 300/300 Mbps or Verizon Fios 300/300 Mbps), that same 650 MB cloud backup uploads in just 18 seconds without consuming even 10% of your total upstream capacity—leaving video conferences completely untouched.
Online Gaming Reality: Latency, Jitter, and Bufferbloat (Not Download Speed)
Generic guides frequently recommend 25 to 50 Mbps download speeds for “online gaming.” This guidance confuses bandwidth (capacity per second) with latency (packet transit time).
Why Multiplayer Games Only Use 0.5 to 3 Mbps of Bandwidth
Online multiplayer games do not stream graphics across the web; visual assets are rendered locally on your PC or console GPU. Your internet connection only transmits tiny coordinate packets, player actions, and hit registrations.
Real-world gameplay bandwidth consumption for top competitive titles:
- League of Legends: ~0.10 Mbps (~45 MB/hour)
- Fortnite: ~0.22 Mbps (~100 MB/hour)
- Call of Duty: Warzone: ~0.35 Mbps (~160 MB/hour)
- Valorant: ~0.55 Mbps (~250 MB/hour)
High download speeds only benefit gamers when downloading massive 80GB to 150GB game patches. For actual gameplay, high megabits mean nothing.
Target Gaming Network Specifications
Flawless online gaming performance is governed by responsiveness, stability, and queue health:
How to Fix Gaming Lag and Bufferbloat
- Test Your Network: Run the free Waveform Bufferbloat Test. If your latency spikes from 20 ms idle to 150+ ms during download/upload tests, your router has bufferbloat.
- Enable Smart Queue Management (SQM): Use a router that supports CAKE or FQ-CoDel (found in modern routers, eero, Ubiquiti, or OpenWrt firmware). SQM prioritizes lightweight gaming packets over bulk file transfers.
- Cap Bandwidth at 90%: In your router settings, set upstream and downstream caps to 90–95% of your plan’s maximum speed. This prevents your modem’s unmanaged hardware buffers from filling up.
Fiber vs. Cable vs. 5G Home Internet: Real-World Latency & Peak Congestion
When matching your speed requirements to a provider, the underlying network technology is far more important than the headline download speed:
| Performance Metric | Fiber-to-the-Home (FTTH) | Gigabit Cable (HFC DOCSIS 3.1) | 5G Fixed Wireless (FWA) |
|---|---|---|---|
| Idle Latency (Ping) | 5 – 12 ms | 12 – 25 ms | 25 – 55 ms (median ~35–45 ms) |
| Loaded Latency (Bufferbloat) | 10 – 25 ms (Low) | 40 – 150+ ms (Moderate to High) | 80 – 250+ ms (High) |
| Upload Speed Delivery | Symmetrical (100% of download) | Asymmetrical (10–35 Mbps typical) | Asymmetrical (10–25 Mbps median) |
| Peak-Hour Speed Drop (7–11 PM) | < 5% – 8% drop | 15% – 30% drop | 30% – 50%+ drop (Cell deprioritization) |
| Data Allowance | Unlimited Data ($0 fees) | Often capped at 1.2 TB ($10/50GB) | Unlimited Data ($0 fees) |
| Typical Ongoing Price | $50 – $80 / month | $70 – $115 / month | $50 – $70 / month |
- Fiber-to-the-Home (AT&T Fiber, Verizon Fios, Google Fiber): Delivers the gold standard with symmetrical uploads, near-zero bufferbloat, and virtually no evening peak-hour slowdowns.
- Cable Internet (Spectrum, Xfinity, Cox): Delivers fast downloads, but suffers from low upload caps and 15–30% speed degradation during prime-time evening hours due to shared neighborhood nodes.
- 5G Home Internet (T-Mobile, Verizon 5G Home, AT&T Air): Convenient and affordable, but traffic is deprioritized (QCI 8/9) behind mobile phone users. When evening cellular traffic surges, speeds can drop by 30% to 50% with latency climbing above 100 ms.
How to Spot Hidden Fees Using FCC Broadband Facts Labels
Under FCC regulations, all internet service providers are legally required to display standardized Broadband Facts labels (modeled after FDA nutrition labels) at the point of sale.
Always review the Broadband Facts label before signing up to catch four common traps:
Real-World Provider Pricing: Promo vs. Ongoing Rates
- AT&T Fiber 300 Mbps: $55.00/mo flat ongoing rate ($35/mo bundled with wireless). $0 equipment fee, unlimited data, symmetrical 300/300 Mbps.
- Verizon Fios 300 Mbps: $49.99/mo standard rate with 3-Year Price Guarantee ($30/mo bundled). $0 equipment fee, unlimited data, symmetrical 300/300 Mbps.
- Spectrum Internet 500 Mbps: $40.00/mo promotional rate for 12 months; jumps to $79.99/mo in month 13 (+$40/mo hike) plus $7.00/mo Wi-Fi router fee.
- Xfinity Connect 300 Mbps: $35.00–$40.00/mo promotional rate; jumps to $70.00–$80.00/mo post-promo (+100% hike) plus $15.00/mo gateway rental fee.
The 30-Second Household Bandwidth Calculator
Calculate your household’s precise speed tier in 30 seconds using this formula:
- Base User Allocation: Allocate 25 Mbps for each regular internet user in your home.
- Concurrent 4K Streams: Add 25 Mbps for each television that frequently streams 4K video at the same time.
- Remote Workers: Add 25 Mbps for each work-from-home professional (for HD video calls, VPN overhead, and file syncing).
- Cloud Security Cameras: Add 5 Mbps for each continuous-recording security camera (Nest, Ring, Wyze).
- Peak Congestion Buffer: Add 20% to the subtotal to account for peak-hour overhead and background device updates.
Calculation Walkthrough (Active Family of 4):
- 4 Users (4 x 25 Mbps) = 100 Mbps
- 2 Concurrent 4K TV Streams = 50 Mbps
- 1 Remote Worker on Zoom/VPN = 25 Mbps
- 3 Outdoor Security Cameras = 15 Mbps
- Subtotal: 190 Mbps
- + 20% Headroom Buffer: 190 x 1.20 = 228 Mbps
Target Recommendation: A standard 300 Mbps plan covers this entire household with complete reliability.
How to Match Your Speed Tier on Compare Internet Hub
Once you know your target number, do not let an ISP sales representative upsell you into an expensive gigabit package:
- Search Your Address: Go to Compare Internet Hub and enter your 5-digit ZIP code.
- Filter by Your Target Tier: Filter search results specifically for 300 Mbps or 500 Mbps plans.
- Prioritize Symmetrical Fiber: If a fiber provider (AT&T Fiber, Verizon Fios, Frontier Fiber, Google Fiber) is available at your address, choose a 300 Mbps Fiber plan over a 500 Mbps or 1,000 Mbps Cable plan. Symmetrical upload speeds and single-digit latency deliver a vastly superior user experience.
- Audit the 2-Year Total Cost: Compare total costs including gateway rental fees and post-promo price increases rather than introductory teaser rates.
Frequently Asked Questions (FAQ)
How much internet speed do I actually need for a home?
Most multi-person households need 300-500 Mbps download speed. This capacity provides sufficient headroom to run multiple 4K video streams (25 Mbps each), remote Zoom meetings (4 Mbps), and active online gaming (0.5–3 Mbps) simultaneously without network congestion. Single-person households can operate comfortably on 100 Mbps.
Why does my internet stream buffer even though I pay for 1 Gig?
Streaming buffering on a gigabit plan is usually caused by in-home hardware limitations rather than incoming internet speeds. Most 4K Smart TVs contain 100 Mbps Fast Ethernet ports capped at ~95 Mbps real-world speeds, while 2.4 GHz Wi-Fi connections top out at 50–100 Mbps. Additionally, modem bufferbloat or peak-hour Wi-Fi channel interference can trigger latency spikes that cause video streams to buffer.
Is fiber internet better than cable for online gaming and remote work?
Yes, fiber internet is significantly superior to cable for gaming and remote work because it delivers symmetrical upload speeds, single-digit latency (5–12 ms), and minimal bufferbloat. Cable connections feature low upload caps (10–20 Mbps) that saturate quickly during background cloud backups, causing Zoom calls to freeze and gaming ping to spike.
How do I know if fiber internet is available at my address?
You can verify true Fiber-to-the-Home (FTTH) availability by entering your ZIP code on Compare Internet Hub or checking the provider’s FCC Broadband Facts label. If the label displays symmetrical upload and download speeds (such as 300 Mbps down and 300 Mbps up), it is true fiber. If it displays high download speeds alongside low upload speeds (like 1,000 Mbps down and 35 Mbps up), the address is served by cable.
Why does my Zoom video call freeze when uploading photos?
Zoom calls freeze during photo uploads because background cloud backups saturate asymmetrical upload pipes (10–20 Mbps on cable). Cloud uploads use unthrottled TCP sessions that consume 100% of available upstream capacity, creating severe modem bufferbloat (latency spikes of 800–2,500 ms) and starving the outgoing TCP ACK packets required to maintain your incoming Zoom video feed.
Updated on: November 4, 2026