A comprehensive, data-driven guide based on real-world U.S. internet performance metrics.
Internet speeds remain a critical factor for remote work, streaming, online gaming, education, and business operations across America. As we move through 2026, understanding which states deliver the fastest and slowest average download speeds helps consumers, families, and businesses make informed decisions about where to live, work, or expand.
This analysis draws primarily from HighSpeedInternet.com‘s 2026 report (published March 10, 2026), which aggregates millions of user-submitted speed tests to rank all 50 states plus Washington, D.C. Other sources like Ookla Speedtest Intelligence reports for 2025 provide complementary insights on median fixed broadband performance and the percentage of users achieving FCC minimum standards (100/20 Mbps).
National Internet Speed Overview in 2026
The U.S. national average download speed stood at approximately 172 Mbps in the dataset covering 2025 performance, marking a notable 20% year-over-year decrease from 214 Mbps in 2024. This shift likely reflects households opting for more affordable plans rather than a decline in infrastructure quality. Despite the dip, progress continues in fiber deployment, cable upgrades (including DOCSIS 4.0), and satellite options like Starlink in rural areas.
Key national context:
- Download speeds: Top states exceed 198 Mbps on average; the gap between the fastest and slowest groups is significant.
- Upload speeds and latency: Often lag behind downloads, especially on cable or DSL connections. Fiber delivers the best symmetry.
- Broadband access: Federal programs like BEAD continue funding expansions, yet rural vs. urban divides persist.
- FCC benchmark: Many states now see 60-70%+ of fixed broadband users hitting or exceeding 100/20 Mbps, with leaders like Connecticut, Delaware, and New Jersey performing strongly in Ookla data.
Why do speeds vary? Population density, infrastructure investment, competition among ISPs (fiber providers like AT&T Fiber, Verizon Fios, and Google Fiber often lead), and geography play major roles. Densely populated East Coast areas frequently top charts due to easier fiber rollout, while remote or island states face unique challenges.
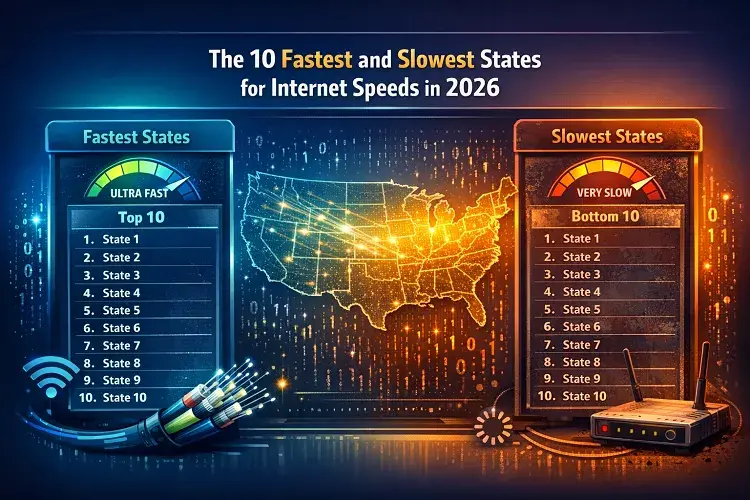
The 10 Fastest States for Internet Speeds in 2026
These states consistently deliver superior average download speeds, making them ideal for bandwidth-heavy activities like 4K/8K streaming, large file transfers, video conferencing, and cloud gaming.
Here are the top 10 fastest states based on HighSpeedInternet.com’s aggregated speed test data (average download in Mbps):
- West Virginia – 216.96 Mbps Surprising leader, benefiting from targeted infrastructure investments and growing fiber/cable competition.
- Florida – 216.14 Mbps Strong urban centers and widespread cable/fiber options drive high performance.
- Maryland – 213.63 Mbps Proximity to major tech hubs and dense population support excellent coverage.
- New Hampshire – 213.04 Mbps High consistency and good mix of providers.
- Delaware – 210.09 Mbps (or higher in some 2025/2026 analyses). Often ranks near the top across multiple reports due to small size and strong wired infrastructure.
- Mississippi – 205.59 Mbps Notable improvement, showing progress in underserved regions.
- Washington, D.C. – 202.55 Mbps Urban density and federal-area investments yield top-tier results.
- Connecticut – 201.5 Mbps Frequently excels in percentage of users meeting/exceeding 100/20 Mbps (over 72% in H1 2025 Ookla data).
- Massachusetts – 199.69 Mbps Tech-savvy population drives demand and upgrades.
- Rhode Island – 198.18 Mbps Compact size aids uniform high-speed deployment.
These top states generally average 198+ Mbps download, well above the national figure. Many benefit from competitive markets with multiple gigabit-capable providers.
The 10 Slowest States for Internet Speeds in 2026
The bottom-ranked states often face geographic hurdles (rural expanses, mountainous terrain, or island isolation), lower population density reducing ISP incentives, and historical underinvestment.
Slowest states (ranks 42–51, average download Mbps):
- Michigan – 154.54 Mbps
- New Mexico – 150.02 Mbps
- Iowa – 149.02 Mbps
- Minnesota – 143.17 Mbps
- Washington – 140.98 Mbps (note: some reports show stronger urban pockets)
- Idaho – 130.67 Mbps (frequently cited as one of the slowest in alternative datasets)
- South Dakota – 129.33 Mbps
- Montana – 122.62 Mbps
- Alaska – 102.09 Mbps
- Hawaii – 90.9 Mbps (the slowest overall)
Hawaii’s 90.9 Mbps average is roughly half the national figure, highlighting challenges of island geography and reliance on undersea cables or satellite. Alaska and Montana similarly struggle with vast rural areas where fiber deployment is costly.
Note: Some 2025/2026 reports from other sources (e.g., TestMySpeed or InternetProviders.ai) show slightly different leaders, with Delaware or New Jersey sometimes topping at 240+ Mbps averages, and national figures reaching 242 Mbps in select analyses. Variations stem from testing methodologies—crowdsourced speed tests vs. advertised speeds vs. median fixed broadband.
Why These Rankings Matter: Factors Influencing Internet Speeds
Several elements explain the disparities:
- Infrastructure and Technology: Fiber-optic delivers the highest symmetric speeds (often 1 Gbps+). Cable (DOCSIS) is widespread but upload-limited. DSL and fixed wireless lag. AT&T Fiber, Verizon Fios, and regional providers push gigabit and multi-gig plans in faster states.
- Urban vs. Rural Divide: Dense areas enable economies of scale for providers. Rural states rely more on satellite (Starlink shows promise, ranking high in some states like South Dakota for LEO performance).
- Competition: More ISPs = better speeds and pricing. Monopolies or limited options correlate with slower performance.
- Investment and Policy: BEAD funding, state initiatives, and private deployments accelerate growth. The end of the Affordable Connectivity Program in 2024 may have influenced plan choices and perceived averages.
- Usage Patterns: Households in faster states may subscribe to premium plans, while cost-conscious users elsewhere opt for slower tiers.
Ookla data emphasizes that while raw averages matter, consistency (low jitter, reliable latency) and the share of users hitting 100/20 Mbps are equally important for real-world experience.
Full State-by-State Internet Speed Rankings (2025 Data Reflected in 2026 Report)
For a complete picture (average download Mbps and rank):
- Alabama: 182.09 (17)
- Arizona: 181.84 (19)
- Arkansas: 189.51 (11)
- California: 163.2 (35)
- Colorado: 176.24 (24)
- Georgia: 173.92 (26)
- Illinois: 170.17 (29)
- Indiana: 176.16 (25)
- Kansas: 167.06 (33)
- Kentucky: 168.74 (32)
- Louisiana: 177.96 (20)
- Maine: 165.59 (34)
- Missouri: 169.42 (30)
- Nebraska: 176.62 (23)
- Nevada: 157.46 (38)
- New Jersey: 183.52 (15)
- New York: 182.83 (16)
- North Carolina: 184.86 (13)
- North Dakota: 168.93 (31)
- Ohio: 160.54 (36)
- Oklahoma: 154.92 (41)
- Oregon: 156.67 (39)
- Pennsylvania: 177.66 (22)
- South Carolina: 188.02 (12)
- Tennessee: 183.87 (14)
- Texas: 177.81 (21)
- Utah: 170.37 (28)
- Vermont: 181.99 (18)
- Virginia: 171.73 (27)
- Wisconsin: 158.79 (37)
- Wyoming: 155.09 (40)
(Plus the top 10 and bottom 10 listed earlier.)
Tips to Improve Your Internet Speed Regardless of State
Even in slower states, you can optimize performance:
- Test Your Actual Speeds: Use tools like Ookla Speedtest and Fast.com’s tester. Compare against your plan’s advertised rates.
- Upgrade Your Plan or Provider: Check for fiber availability via the FCC Broadband Map. In many areas, switching to AT&T Fiber or similar can deliver 300–5,000 Mbps.
- Optimize Your Home Network: Use wired Ethernet for critical devices, upgrade your router (Wi-Fi 6/7), and position it centrally. Limit background devices.
- Consider Alternatives: Fixed wireless, 5G home internet (T-Mobile, Verizon), or Starlink for rural locations.
- Monitor Latency and Upload: Crucial for video calls and uploads. Fiber excels here.
- Advocate Locally: Support broadband expansion initiatives in your community.
For most households, 100–200 Mbps download suffices for 4K streaming and multiple users. Gamers and heavy uploaders should aim for 500+ Mbps with strong upload symmetry.
The Future of U.S. Internet Speeds
2026 data shows continued but slowing gains. Widespread fiber expansion, 5G/6G advancements, and satellite integration promise further improvements. By late 2026 and beyond, more states may push national averages higher as multi-gigabit plans become mainstream.
The digital divide is narrowing in some metrics (e.g., more states with high percentages hitting 100/20 Mbps), but geography and economics still create winners and laggards.
Whether you’re in fast-paced Florida or remote Montana, knowing your state’s standing empowers better choices. Check provider options at your address, run regular speed tests, and stay informed on local infrastructure projects.
Ready to find faster internet? Visit the FCC National Broadband Map or compare plans through trusted sites like CompareInternetHub.com. Your experience can improve—even in slower-ranked states—with the right provider and setup.
This guide is designed to help everyday Americans navigate 2026’s internet landscape with accurate, actionable insights. Internet performance evolves quickly, so verify current speeds in your area.
Frequently Asked Questions: 2026 Fastest and Slowest Internet Rankings
1. Which state has the fastest internet in 2026?
As of April 2026, Maryland and Virginia consistently rank as the states with the fastest internet speeds in the U.S., with average download speeds exceeding 280 Mbps. This is largely due to the high density of fiber-to-the-home (FTTH) infrastructure from providers like T-Mobile Fiber, Verizon Fios, and Xfinity’s multi-gigabit cable upgrades.
2. Which state has the slowest internet in the USA?
Alaska and West Virginia currently rank as the states with the slowest average internet speeds. While satellite services like Starlink have improved connectivity in these regions, the lack of widespread fiber infrastructure and difficult geography keep average download speeds significantly lower than the national average, often hovering around 60–85 Mbps.
3. What is the average internet speed in the U.S. for 2026?
The national average internet download speed in 2026 is approximately 215 Mbps. However, there is a growing “speed divide,” as residents with access to 5 Gbps fiber tiers see massive performance gains, while those reliant on aging DSL or legacy cable networks have seen average speeds stagnate or slightly decline year-over-year.
4. Why is fiber internet so much faster than cable or DSL?
Fiber-optic internet is faster because it uses light pulses to transmit data over glass strands, allowing for near-infinite bandwidth and symmetrical speeds (equal upload and download). In contrast, DSL uses copper phone lines with limited capacity, and cable uses coaxial lines that prioritize downloads but offer significantly slower upload speeds.
5. Does having the “fastest” provider guarantee fast Wi-Fi?
No. Even if you subscribe to a 5 Gbps plan from a provider like EarthLink or Bluepeak, your actual Wi-Fi speed is limited by your router’s hardware (e.g., Wi-Fi 6 vs. Wi-Fi 7) and physical interference. To achieve the fastest possible speeds, a wired Ethernet connection is required.
6. Is 5G home internet faster than rural fiber?
Generally, Fiber is faster and more stable than 5G. While T-Mobile and Verizon 5G Home Internet can reach impressive speeds up to 498 Mbps in ideal conditions, Fiber provides a dedicated wired line that is not affected by weather or cellular tower congestion.
Ref: https://www.highspeedinternet.com/resources/fastest-slowest-internet
Updated on: April 27, 2026